理解CUDA内存使用情况
为了调试 CUDA 内存使用情况,PyTorch 提供了一种生成内存快照的方法,该快照记录了在任意时刻分配的 CUDA 内存状态,并可选地记录导致该快照的分配事件历史。
生成的快照可以拖放到pytorch.org/memory_viz上托管的交互式查看器中,该查看器可用于探索快照。
生成快照
记录快照的常见模式是启用内存历史记录,运行要观察的代码,然后保存一个包含序列化快照的文件:
# enable memory history, which will
# add tracebacks and event history to snapshots
torch.cuda.memory._record_memory_history()

run_your_code()
torch.cuda.memory._dump_snapshot("my_snapshot.pickle")
使用可视化工具
打开 pytorch.org/memory_viz 并将 pickled 快照文件拖放到可视化工具中。 该可视化工具是一个在您的计算机上本地运行的 JavaScript 应用程序。它不会上传任何快照数据。
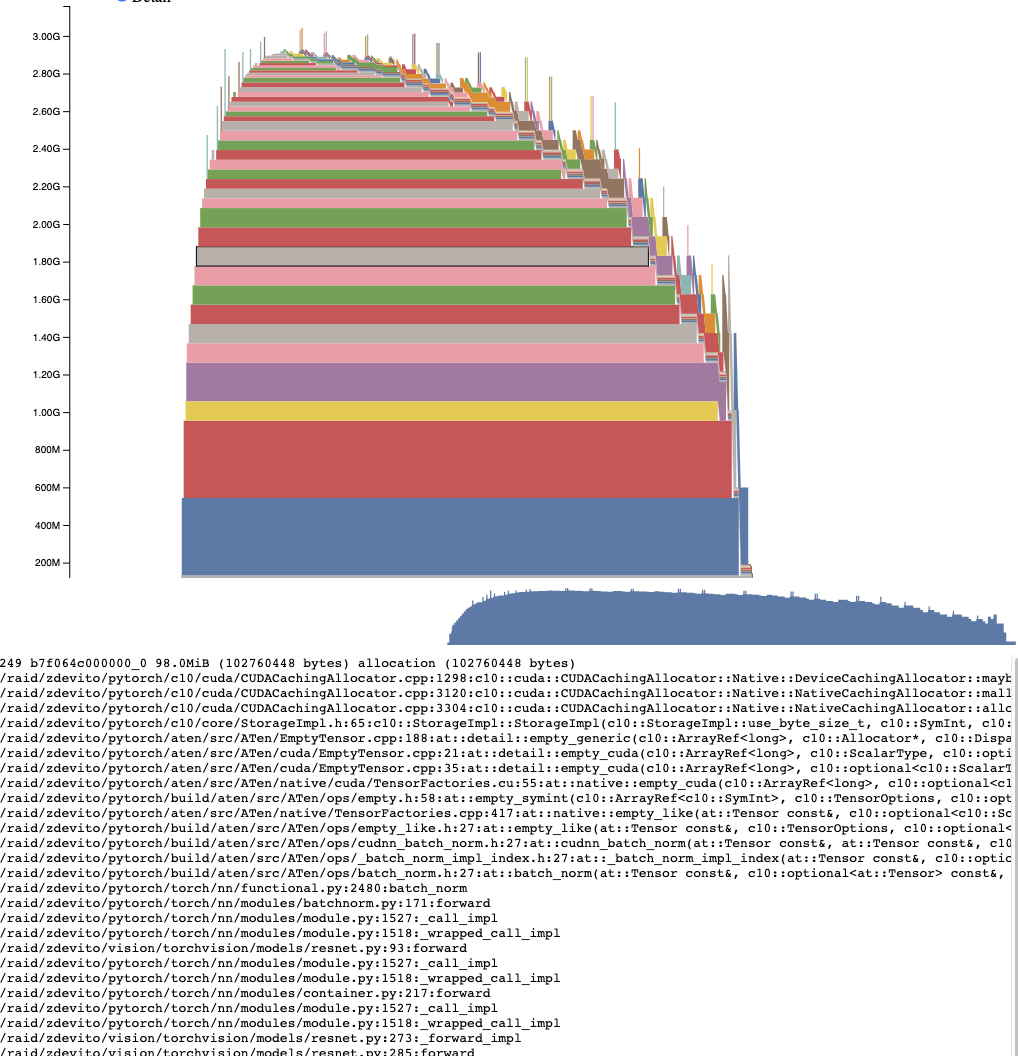
活跃内存时间线
活动内存时间轴显示了特定 GPU 上快照中所有随时间变化的张量。通过平移/缩放图表,可以查看较小的内存分配。 将鼠标悬停在已分配的内存块上,可以看到该内存块分配时的堆栈跟踪信息及其地址等详细信息。可以通过调整细节滑块来减少渲染的分配数量,以提高大量数据情况下的性能。
分配器状态历史
分配器状态历史显示左侧时间轴上的各个分配器事件。选择时间轴上的一个事件,以查看该事件发生时分配器状态的可视化摘要。此摘要展示了每个由 cudaMalloc 返回的单独段及其如何被分割为独立分配或空闲空间的块。将鼠标悬停在段和块上,可查看内存分配时的堆栈跟踪。将鼠标悬停在事件上,可查看事件发生时的堆栈跟踪,例如张量被释放时。内存不足错误将以 OOM 事件的形式报告。在 OOM 发生时查看内存状态可能会提供有关为何分配失败的见解,即使仍存在预留内存。
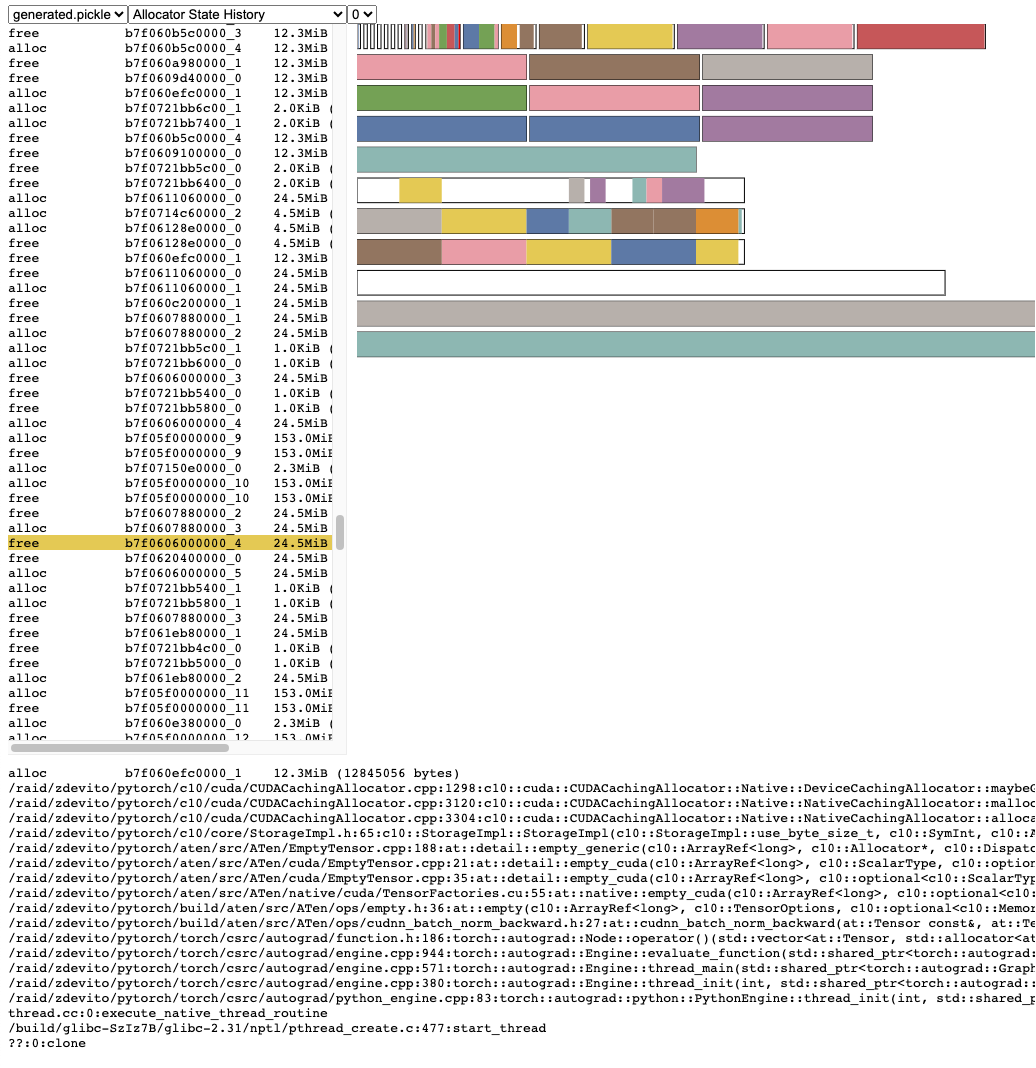
堆栈跟踪信息还报告了分配发生时的地址。 地址 b7f064c000000_0 指的是地址 7f064c000000 处的 (b) 块,这是该地址被分配的第 “_0” 次。 此唯一字符串可以在活动内存时间轴中查找,并在活动状态历史记录中搜索,以检查张量被分配或释放时的内存状态。
快照API参考
- torch.cuda.memory._record_memory_history(enabled='all', context='all', stacks='all', max_entries=9223372036854775807, device=None)[source]
启用与内存分配相关的堆栈跟踪记录,以便您可以知道是什么分配了内存中的任何一部分
torch.cuda.memory._snapshot()。此外,除了为每个当前的分配和释放保留堆栈跟踪外,这还将启用记录所有分配/释放事件的历史记录。
使用
torch.cuda.memory._snapshot()来检索此信息, 并使用_memory_viz.py中的工具来可视化快照。Python 跟踪收集速度很快(每条跟踪 2 微秒),因此如果你预计可能需要调试内存问题,可以考虑在生产任务中启用此功能。
C++ 跟踪收集也非常快速(约 50 纳秒/帧),对于许多典型程序来说,每个跟踪大约需要 2 微秒,但会根据栈深度有所不同。
- Parameters
启用 (字面量[无, "状态", "全部"], 可选) – None,禁用记录内存历史。 “state”,保留当前分配内存的信息。 “all”,另外还保留所有分配/释放调用的历史。 默认为“全部”。
上下文 (字面量[无, "状态", "分配", "全部"], 可选) – None, 不记录任何回溯。 “state”, 记录当前已分配内存的回溯。 “alloc”, 此外还保留分配调用的回溯。 “all”, 此外还保留释放调用的回溯。 默认为“全部”。
堆栈 (Literal["python", "all"], 可选) – “python”, 包括Python、TorchScript和inductor帧在回溯中 “all”, 进一步包括C++帧 默认为“all”。
max_entries (int,可选) – 在记录的历史中保留最多max_entries 次分配/释放事件。
- torch.cuda.memory._snapshot(device=None)[source]
在调用时保存当时的 CUDA 内存状态快照。
状态以具有以下结构的字典形式表示。
class Snapshot(TypedDict):
    segments : List[Segment]
    device_traces: List[List[TraceEntry]]

class Segment(TypedDict):
    # Segments are memory returned from a cudaMalloc call.
    # The size of reserved memory is the sum of all Segments.
    # Segments are cached and reused for future allocations.
    # If the reuse is smaller than the segment, the segment
    # is split into more then one Block.
    # empty_cache() frees Segments that are entirely inactive.
    address: int
    total_size: int #  cudaMalloc'd size of segment
    stream: int
    segment_type: Literal['small', 'large'] # 'large' (>1MB)
    allocated_size: int # size of memory in use
    active_size: int # size of memory in use or in active_awaiting_free state
    blocks : List[Block]

class Block(TypedDict):
    # A piece of memory returned from the allocator, or
    # current cached but inactive.
    size: int
    requested_size: int # size requested during malloc, may be smaller than
                        # size due to rounding
    address: int
    state: Literal['active_allocated', # used by a tensor
                'active_awaiting_free', # waiting for another stream to finish using
                                        # this, then it will become free
                'inactive',] # free for reuse
    frames: List[Frame] # stack trace from where the allocation occurred

class Frame(TypedDict):
        filename: str
        line: int
        name: str

class TraceEntry(TypedDict):
    # When `torch.cuda.memory._record_memory_history()` is enabled,
    # the snapshot will contain TraceEntry objects that record each
    # action the allocator took.
    action: Literal[
    'alloc'  # memory allocated
    'free_requested', # the allocated received a call to free memory
    'free_completed', # the memory that was requested to be freed is now
                    # able to be used in future allocation calls
    'segment_alloc', # the caching allocator ask cudaMalloc for more memory
                    # and added it as a segment in its cache
    'segment_free',  # the caching allocator called cudaFree to return memory
                    # to cuda possibly trying free up memory to
                    # allocate more segments or because empty_caches was called
    'oom',          # the allocator threw an OOM exception. 'size' is
                    # the requested number of bytes that did not succeed
    'snapshot'      # the allocator generated a memory snapshot
                    # useful to coorelate a previously taken
                    # snapshot with this trace
    ]
    addr: int # not present for OOM
    frames: List[Frame]
    size: int
    stream: int
    device_free: int # only present for OOM, the amount of
                    # memory cuda still reports to be free
- Returns
快照字典对象